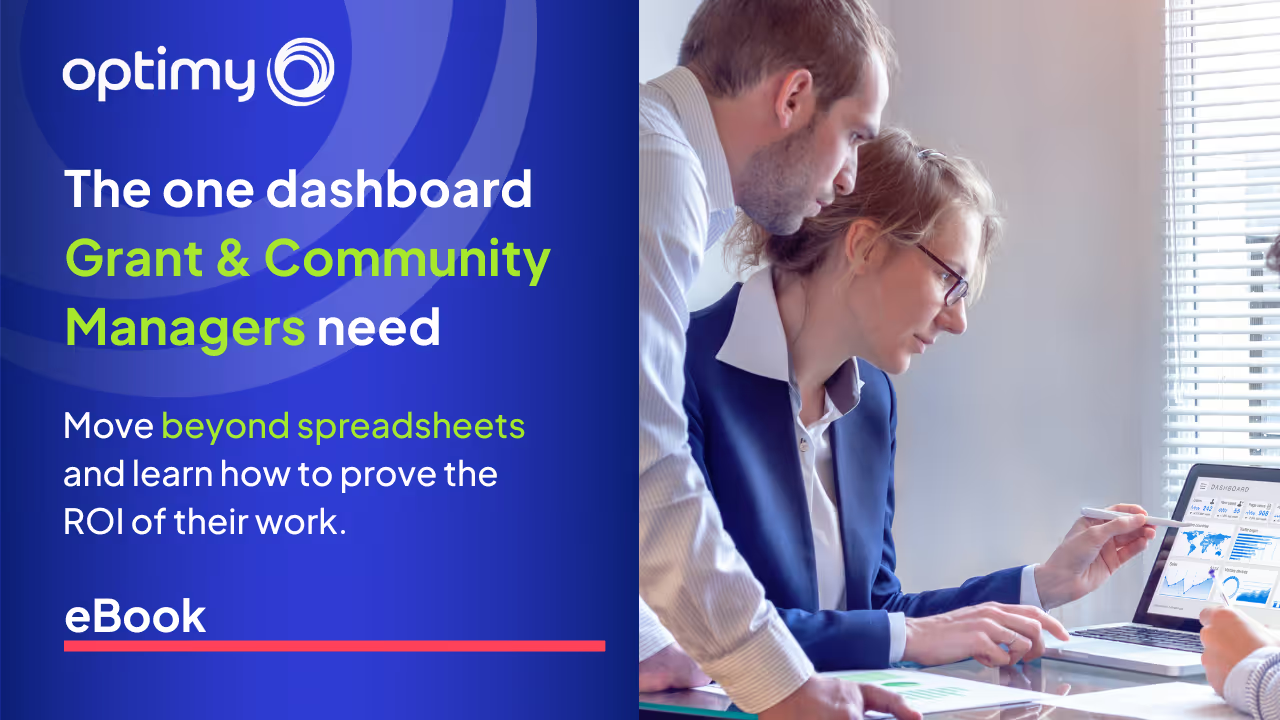

About this Ebook
Managing grants and community work means managing complexity. This guide shows how dashboards do more than save time: they signal leadership, track ROI, and help you scale what works. If your spreadsheet is a bottleneck, this is your way out.
What You’ll Learn:
- Where spreadsheets fall short at scale
- A dashboard framework designed for community impact
- How to tag, filter, and track initiatives with clarity
- How to align data, budget, and outcomes
- Why dashboards signal professional maturity
Built for impact teams that are ready to lead with data.
Download the eBook today! 🚀
Frequently Asked Questions

Other Ebooks
More practical guides for teams that run grant, sponsorship and volunteering programs and have to report on their impact. Pick the next one that fits your challenge.
How to run more Grants with less effort
Learn how to gain operational efficiency in grant management by removing manual work, reducing rework, and building systems that scale without increasing cost or risk.
How to evaluate the real impact of your grant program
Learn how to evaluate the real impact of your grant program by embedding measurability, ROI logic, and decision-ready data into day-to-day operations.

Security & Compliance in Corporate Volunteering
Learn where security and compliance gaps emerge in corporate volunteering and how identity decisions determine exposure long before incidents occur.