June 17, 2026
—
2
min read
(Example) How do I prove the ROI of our grant program to the board of directors?
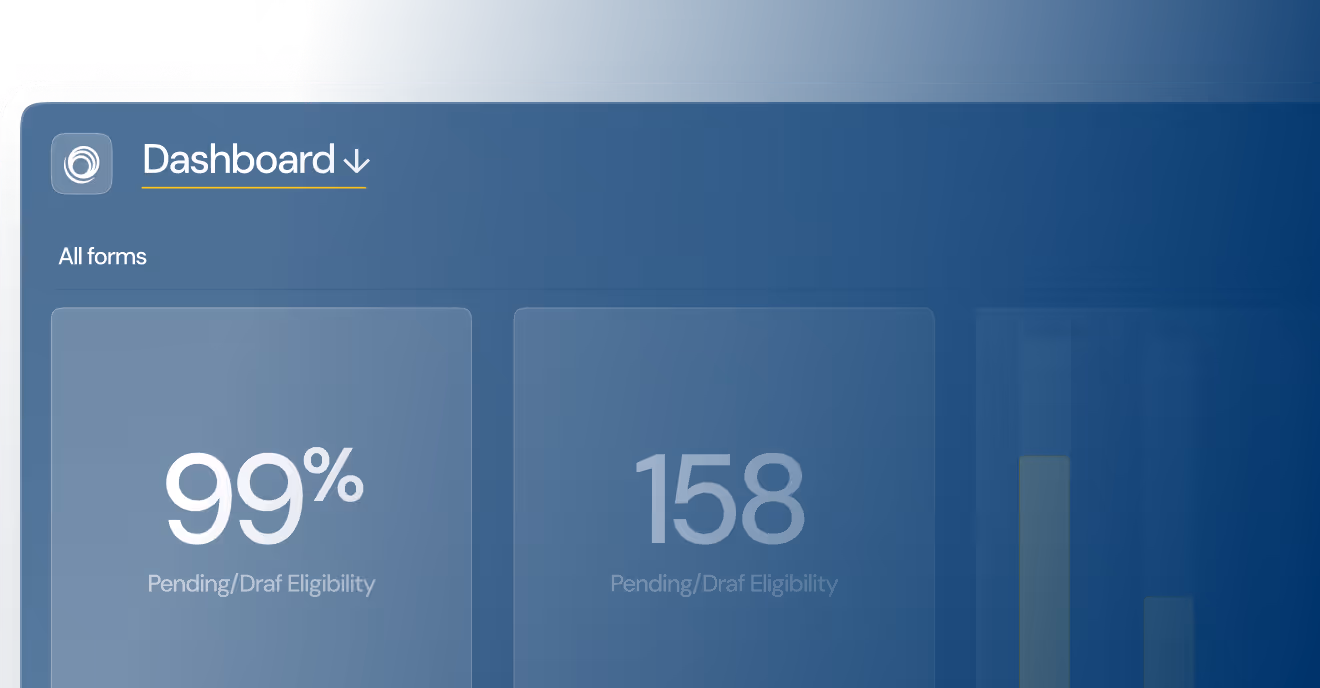
Tie every grant to outcome data and budget spent, then report impact-per-euro in a board-ready dashboard instead of a static slide deck.

Want to see how this dashboard works?
Book a 15-minute demo and we'll show you the exact setup our client uses to track 15+ regional programs.
The difference
What changes when you centralize in one platform?
Before Optimy
Conflicting formats per team
Separate spreadsheets per region
Reports built manually every quarter
No clear sense of ROI
2 weeks to compile global report
After Optimy
Aligned tracking, but room for flexibility per goal
One dashboard for all programs
Auto-generated views filtered by region
Shared view trusted across the organization
2 hours to generate comprehensive dashboard
Ready to centralize your CSR tracking?
See how Optimy helps organizations like yours track KPIs across multiple programs in one place.
GDPR compliant
ISO certified. AWS-hosted (EU + US)
Response within 24 hours
Industry-leading SLA from day one
4,000+ users globally
Trusted across Europe, North America, and beyond
Show more
Most recent questions
Yorem ipsum dolor sit amet, consectetur adipiscing elit. Nunc vulputate libero et velit interdum, ac aliquet odio mattis.