June 26, 2026
2
min read

How do we measure the return on our sponsorship investments?

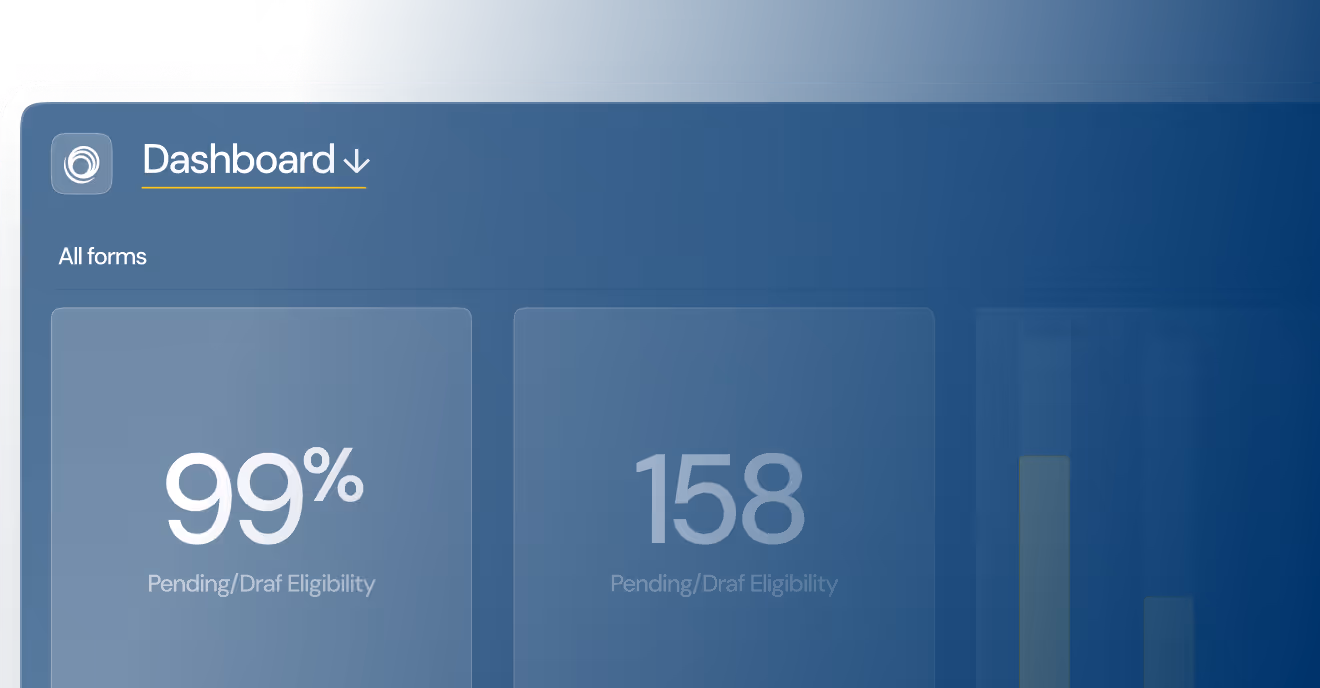
Define the value you expect from each sponsorship upfront (reach, brand, social impact) and track delivery against it in one place.

No items found.
Strategic
Reporting

Marketing and brand teams approve dozens of sponsorships a year. Most of them cannot say, with any confidence, which ones were worth the money.

The logos went up. The events happened. The relationships were maintained. But the audience figures, activations and social outcomes that were supposed to justify each deal were never tracked in a comparable way.

We see the consequences at renewal time. The conversation comes down to gut feeling and internal politics rather than evidence. The sponsorship championed by the loudest stakeholder gets renewed, while a quieter one that delivered more value gets cut.

Part of the problem is that "return" on a sponsorship is genuinely multi-dimensional:

  • Brand exposure.
  • Audience reach.
  • Hospitality.
  • Employee engagement.
  • And, increasingly, social impact.

There is no single number, so teams often give up trying to measure it at all.

The teams that crack this define the expected value of each sponsorship up front, in whatever mix of dimensions matters for that deal. Then they track delivery against those expectations in one place, over the life of the agreement.

It turns the renewal decision from an argument into a comparison. And it gives the team a defensible answer when finance asks what the sponsorship budget actually bought.

Written by

Olivier Hoareau

Olivier leads Marketing and Lead Generation at Optimy. With two decades of experience in digital strategy, SEO, and B2B growth, he writes for the professionals managing grants, sponsorships, and volunteering programs, helping them do more with less, and prove it.
Summary

Want to see how this dashboard works?

Book a 15-minute demo and we'll show you the exact setup our client uses to track 15+ regional programs.

Optimy Wiki dashboard interface mockup
The difference

What changes when you centralize in one platform?

Before Optimy
icon close arrow

Conflicting formats per team

icon close arrow

Separate spreadsheets per region

icon close arrow

Reports built manually every quarter

icon close arrow

No clear sense of ROI

icon close arrow

2 weeks to compile global report

After Optimy
icon check

Aligned tracking, but room for flexibility per goal

icon check

One dashboard for all programs

icon check

Auto-generated views filtered by region

icon check

Shared view trusted across the organization

icon check

2 hours to generate comprehensive dashboard

Ready to centralize your CSR tracking?

See how Optimy helps organizations like yours track KPIs across multiple programs in one place.

icon quality
GDPR compliant
ISO certified. AWS-hosted (EU + US)
icon quality
Response within 24 hours
Industry-leading SLA from day one
icon quality
4,000+ users globally
Trusted across Europe, North America, and beyond
Show more

Most recent questions

The latest questions teams have brought to us, answered in plain language and added straight to the knowledge base.

No items found.
Operations
Reporting

How do we manage research grant reviews and track project milestones?

Run expert review through a structured workflow, then track funded projects against milestones and reporting deadlines in the same system.

Read more
Answered by
Olivier Hoareau
Research Grant Management
No items found.
Operations
Reporting

How do we select scholarship recipients fairly and transparently?

Apply consistent eligibility and scoring criteria to every applicant, with each decision recorded, so awards are defensible and bias-aware.

Read more
Answered by
Olivier Hoareau
No items found.
No items found.
Budget
Operations

How do we manage corporate donations and matching gifts in one place?

Centralise donation requests, approvals and employee match claims, so giving is tracked and reportable instead of spread across emails.

Read more
Answered by
Olivier Hoareau
No items found.